
See where your plant loses time, shift by shift.
Operators log stops, scrap, rework and changeovers as they happen, by voice, photo or text. Shopfloor AI ranks the losses, groups what keeps repeating and checks whether each fix held.
The problem
Why the biggest losses stay hidden
Every plant knows where it loses time, roughly. Few can say how much, on which line, and whether last month’s fix made a difference.
Losses are known, never measured
Small losses never get written down
Fixes are never checked
How it works
From a stop on the line to a fix that held
-
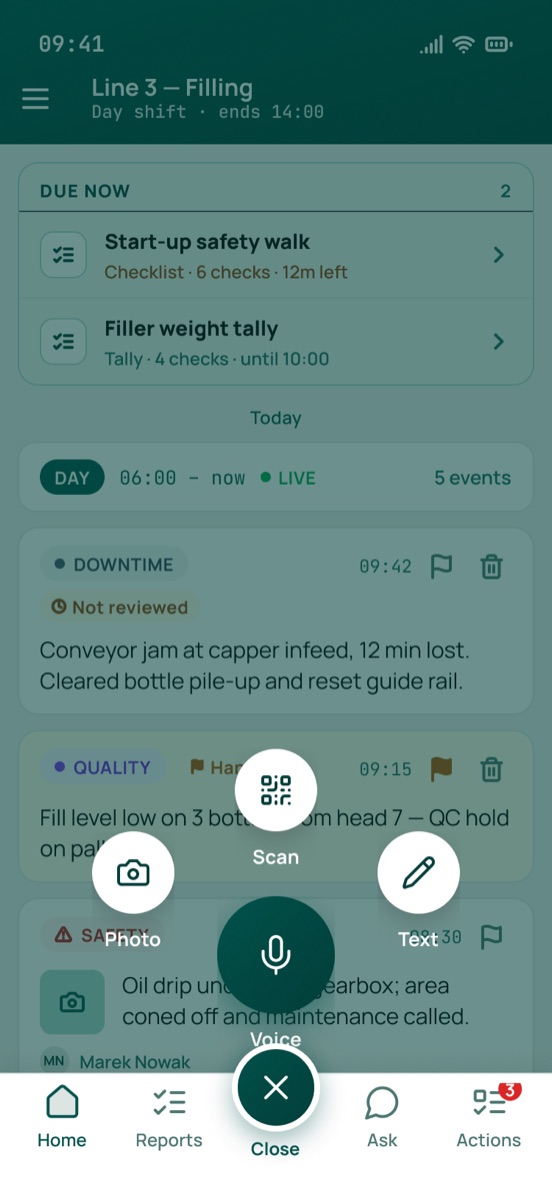
Log the loss where it happens
Operators speak, photograph or type what stopped the line, what was scrapped or reworked, and how long a changeover took. A photo of the shift board adds target against actual for each hour.

-
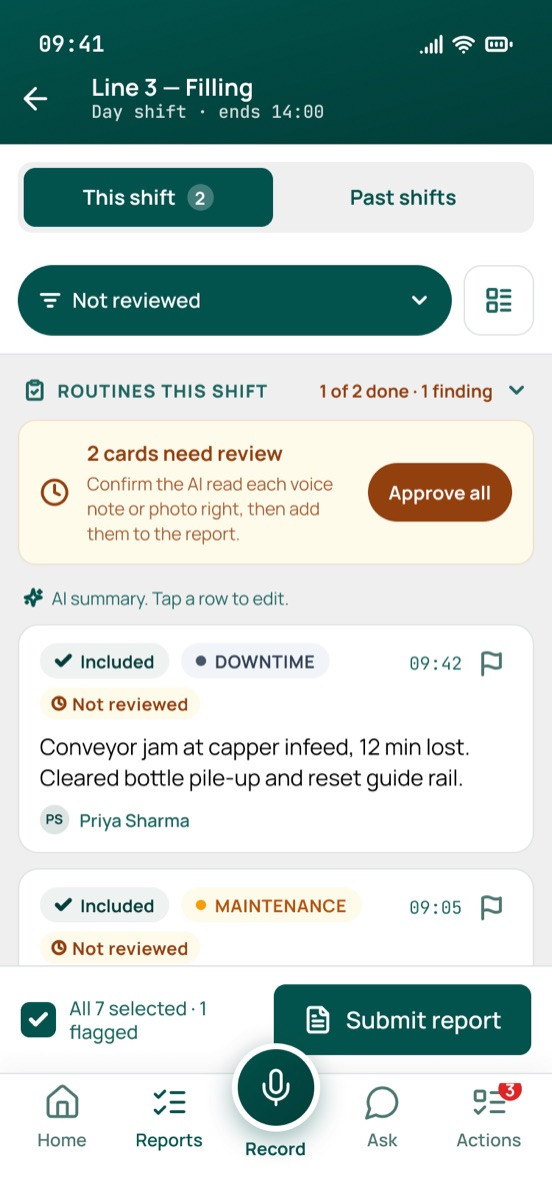
AI turns it into a loss record
Each report becomes an event with its category, line, equipment and shift, and the minutes lost when the operator gives them. Shopfloor AI never estimates a time it wasn’t told.
-
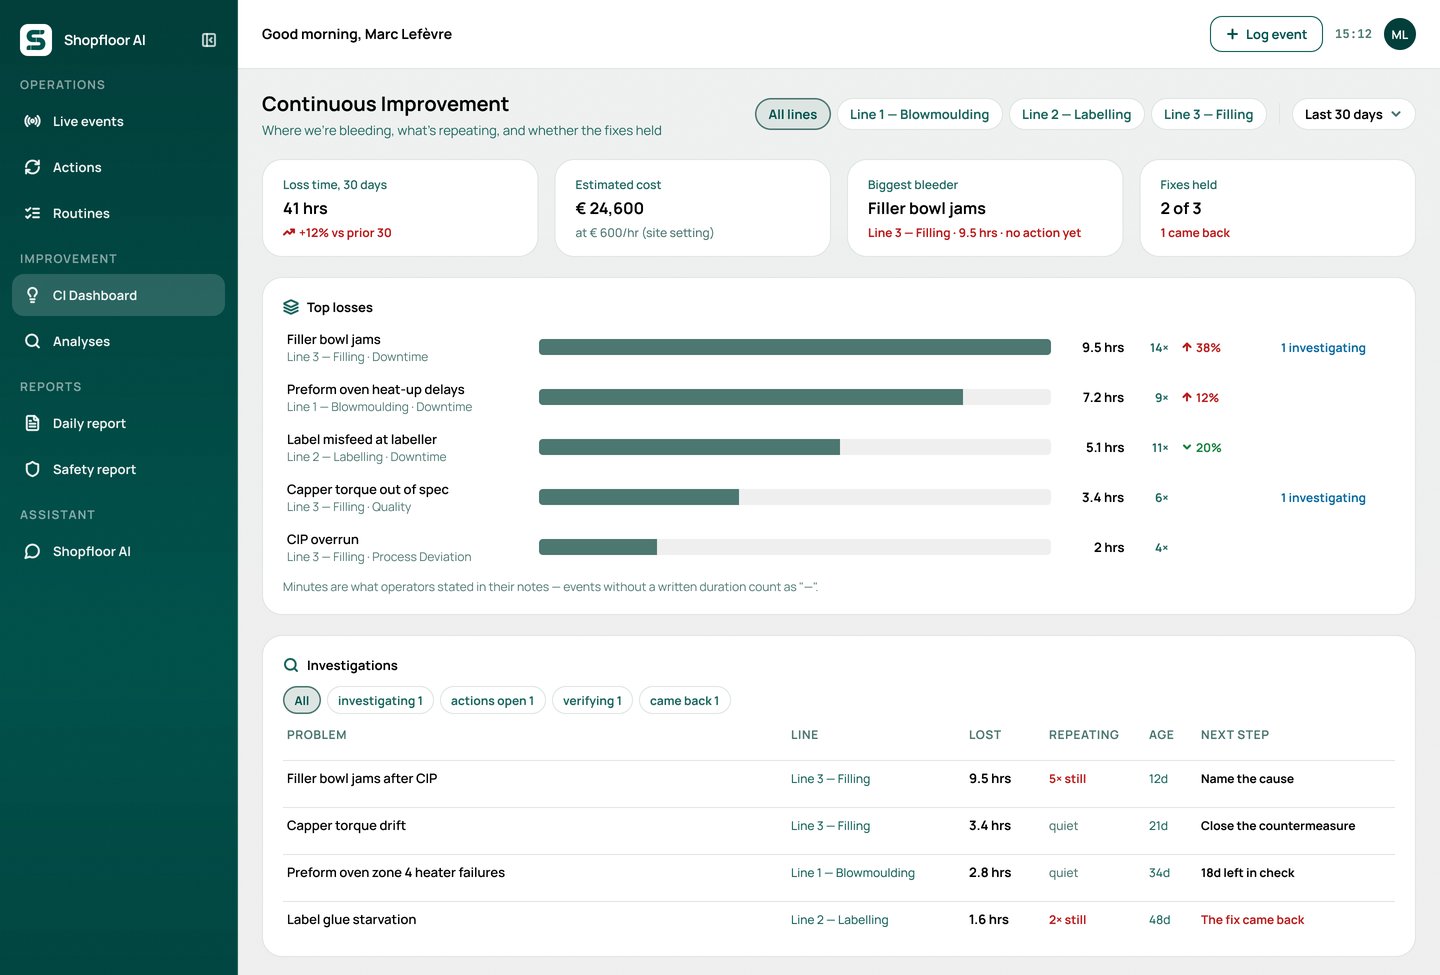
CI ranks the losses and fixes the cause
The continuous-improvement dashboard ranks where the minutes went, with an estimated cost at your site’s rate, what keeps repeating, and the investigations under way, over a week up to a year.
What you get
Loss tracking your CI team can act on
Every kind of loss in one place
Minutes as stated, never guessed
A cost you can stand behind
Repeat losses grouped
Guided root-cause analysis
Fixes that are checked
Questions
Scrap and changeover losses, answered
Other use cases run through the same app. See all use cases.
What counts as a changeover loss?
The time a line isn’t making good product while it switches from one run to the next: stopping, cleaning, swapping formats and parts, and the start-up rejects before the first good units. Shopfloor AI logs changeovers as their own loss category, next to downtime, scrap and rework.
How is lost time measured?
From what operators say in their reports. If someone says a jam cost 12 minutes, that’s recorded; if they don’t give a time, Shopfloor AI never guesses one. Supervisors can correct the minutes afterwards.
Does it calculate OEE?
No. Shopfloor AI doesn’t read machine counters. It captures the stops, scrap and changeovers people see, with their causes, which is the part OEE figures don’t explain. Photos of your shift board add target-versus-actual plan attainment.
How is the cost of a loss estimated?
Lost hours multiplied by one hourly rate you set for the site. If no rate is set, no cost is shown, so the dashboard never presents a made-up number.
Who runs the root-cause investigations?
Your continuous-improvement team starts them; supervisors and managers can follow them. Each investigation builds on the captures and your SOPs, and its recommendations become actions with owners.
How do we know a fix worked?
Every fix is watched for 60 days. If the same loss comes back on that line, the fix is marked as recurred; if it doesn’t, it’s marked as held, and the dashboard shows how many fixes held.
Pilot loss tracking on one line for 90 days
Measure how many hours of stops get logged with a cause, and how many of the fixes held.